Hammer Candlestick Pattern: Candlestick patterns prove to be a valuable tool for traders when conducting technical analysis in the stock market, and the hammer candlestick pattern provides a particularly strong signal of a bullish reversal. This pattern appears at the end of a downtrend, when market prices have been falling for a long time, but buyers suddenly begin to emerge. The unique shape of the hammer pattern resembles a hammer, with a small upper body and a long lower shadow extending downward, which tells traders that even though sellers may try to push prices down, buyers will eventually gain control. Identifying this pattern allows traders to make timely buying decisions and take advantage of a potential market rally.
Structure and Characteristics
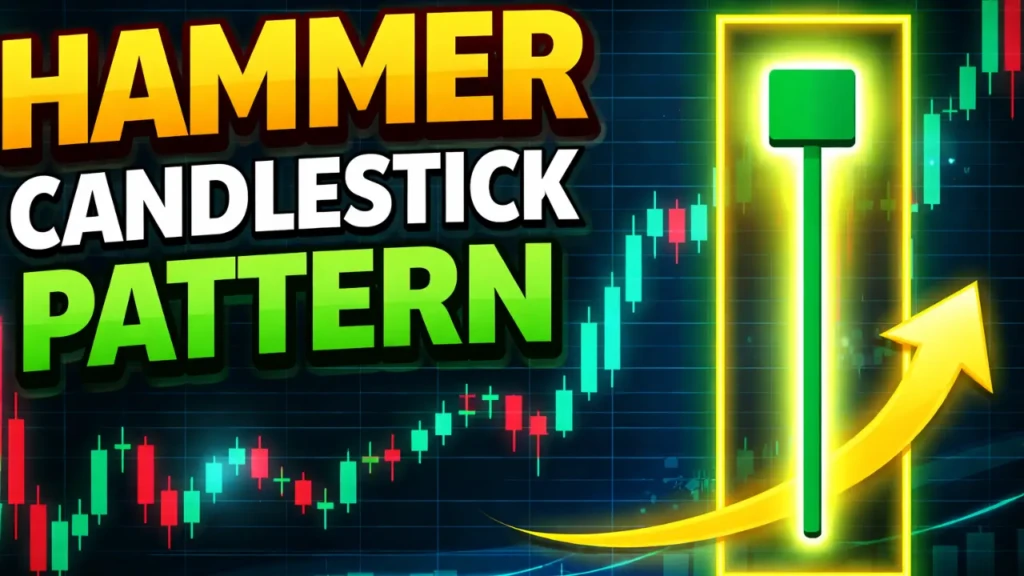
The hammer candlestick pattern is identified by its distinctive shape, with a very small real body located at the top of the candle. Its lower shadow is at least twice the length of the body, while the upper shadow is either very short or absent altogether, giving this pattern a clear distinction. This pattern forms when sellers push prices down at the beginning of a market session, but buyers pull them back up by the end, indicating strength at a support level. Traders can observe this pattern on various timeframes, such as daily, weekly, or intraday charts, but its reliability increases when it develops near a key support level or moving average.
Importance of Hammer Pattern
The appearance of a hammer pattern during a downtrend signals a turning point, as it indicates that sellers’ strength is waning and buyers’ pressure is increasing. The energy stored in the market by the formation of this pattern leads to a rally in the following sessions, especially when the next candle closes green and higher. This pattern is valuable for traders because it helps avoid false signals and can be combined with other indicators like RSI or volume to confirm reversals. In the real market, when a stock has been falling for a long time and suddenly forms a hammer pattern, it instills investor confidence, leading to a natural price surge.
Trading Strategy
Developing a trading strategy using the hammer candlestick pattern is simple but effective. After identifying the pattern, it is necessary to wait for confirmation in the following session. If the next candle opens above the hammer’s high and closes higher with strong volume, it is advisable to take a long position, with a stop loss placed just below the hammer’s lower shadow. Targets can be set using Fibonacci extensions or previous resistance levels to maximize profits. Sometimes, traders combine this pattern with breakouts, as when the hammer forms at the bottom of a channel, the probability of breaking the upper channel increases.
Mistakes and Precautions
When using the hammer pattern, traders often enter hasty trades without confirmation, which can lead to losses. Therefore, it’s always important to assess the next session’s activity. Furthermore, a similar pattern, called the Hanging Man, appears in uptrends and signals a bearish reversal. So, never ignore context. This pattern can be less reliable in high-volatility markets, so validate it against a strong trendline or support zone. Maintain a risk-to-reward ratio better than 1:2 and never invest a large portion of capital in a single trade. By following these precautions, traders can harness the true power of the hammer pattern.
Final Words
The hammer candlestick pattern is a reliable ally in the trading world, offering exceptional opportunities with proper understanding and practice. Traders who use it with regular chart analysis and patience can better navigate market fluctuations. By incorporating this pattern into your trading strategy, you can achieve stable profits over the long term.
Disclaimer
This article is for educational and informational purposes only. It is not any investment advice. Before making any investment-related decision, make sure to consult your financial advisor.