Shooting Star Candlestick Pattern: Studying candlestick patterns in the stock market is a valuable tool for traders, helping them understand market sentiment. The shooting star candlestick pattern is a single candlestick pattern that signals a bearish turn in a bullish market. This pattern appears at the peak of an uptrend and alerts investors that the market may now be turning down. Its distinctive structure clearly indicates buyer fatigue and seller dominance.
Structure of the Shooting Star Pattern
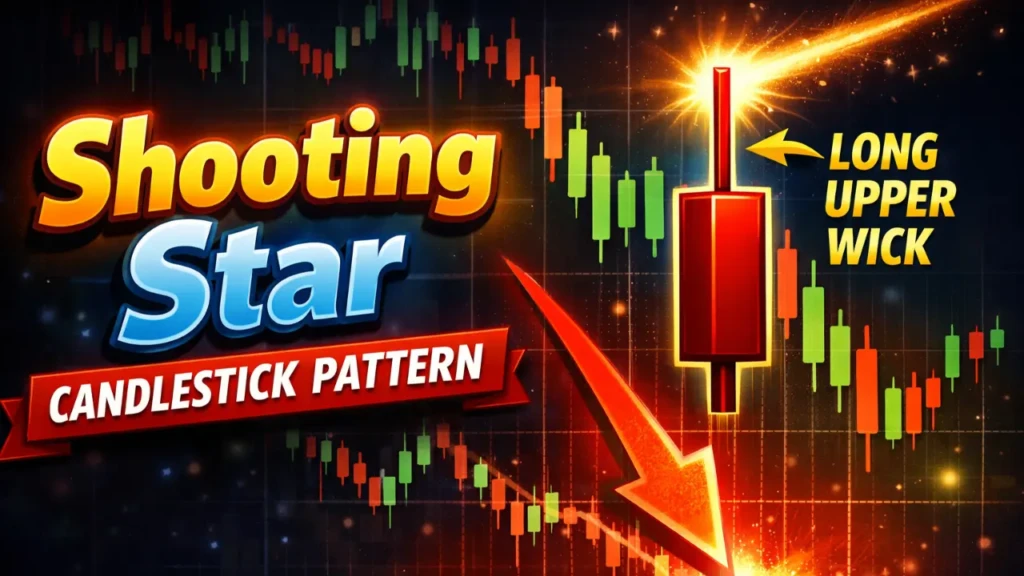
Identifying a shooting star candlestick is extremely simple if you understand its structure thoroughly. In this pattern, the candle’s real body is very small, representing the minimum difference between the opening and closing prices, and the body is located at the bottom of the candle. The most prominent feature is its long upper shadow, which is at least twice as long as the candle’s body, while the lower shadow is either very short or absent altogether.
This structure resembles a comet or shooting star in the sky, giving it its name. When a stock or index reaches a high, a strong push by buyers in the early session creates an upper shadow, but by the end of the session, sellers dominate and push the price back down. This pattern thus marks the beginning of a change in market direction.
Importance in an Uptrend
The full impact of the Shooting Star pattern is revealed when it develops at the top of a clear uptrend. This pattern suddenly emerges after a series of consistently high prices in an uptrend, signaling that the bullish momentum is about to break. Buyers bought enthusiastically early in the day, pushing prices to new highs, but sellers entered the market and erased all gains.
This indicates that resistance at higher levels has strengthened and the likelihood of further declines has increased. Traders should be cautious when they see this pattern, as it not only signals an immediate reversal but can also signal the beginning of a prolonged downtrend. In real life, this pattern often appears at market peaks, such as a stock’s all-time high, where investors begin to book profits.
Identification and Confirmation
Accurately identifying the Shooting Star pattern in the market requires adherence to certain criteria. First, this pattern is valid only after an uptrend; otherwise, its significance diminishes. Second, the upper shadow must be twice the length of the body, which underlines the failure of buyers. Third, the next candle must be bearish, which confirms the Shooting Star—that is, the next session must open near the previous close and close below it.
High trading volume further strengthens this confirmation, as it indicates that sellers have indeed become active. If a bullish candle forms after the shooting star, the pattern is invalidated. Experienced traders zoom in on the chart to identify it and compare it to the past few sessions. This correct identification can help avoid false signals.
Trading Strategy
To incorporate the Shooting Star pattern into your trading strategy, carefully determine your stop loss and target. Upon confirmation of the pattern, take a short position, with the entry at the low of the next candle. Place the stop loss slightly above the high of the shooting star to limit losses if the market turns higher. Choose a target level two or three times the size of the pattern’s body, or aim for the nearest support line. Use this pattern in conjunction with other indicators, such as the RSI or moving averages—if the RSI is in overbought territory, the signal’s reliability increases.
Comparison with Other Patterns
To understand the Shooting Star, it is useful to compare it to the Hammer pattern, which is its inverse. The hammer appears at the end of a downtrend with a long lower shadow and signals a bullish trend, while the shooting star acts in the opposite direction. Similarly, the inverted hammer also has an upper shadow but gives a weak bearish signal in an uptrend. The evening star is a three-candle pattern, in which the shooting star can be the middle candle.
Practical Example and Limitations
Imagine a stock rises from ₹500 to ₹600. In one session, it rose to ₹620 but closed at ₹505, creating a long upper shadow. The next day, it declines, confirming the shooting star. Such examples appear frequently in the market. However, this pattern also has limitations—it can give false signals in a sideways market or be influenced by news events. Therefore, always perform multi-timeframe analysis. Practice increases its success rate.
Disclaimer
This article is for educational and informational purposes only. It is not any investment advice. Before making any investment-related decision, make sure to consult your financial advisor.