Morning Star Candlestick Pattern: Candlestick patterns serve as reliable guides for traders in the volatile world of the stock market, and the Morning Star pattern is one such bullish reversal pattern, signaling a surge after a deep downturn. This pattern not only simplifies the art of technical analysis but also helps traders multiply their profits by providing timely buying opportunities. When the market appears to be heading downwards, this pattern shines like a new dawn, offering investors a ray of hope.
Basic Structure of This Pattern
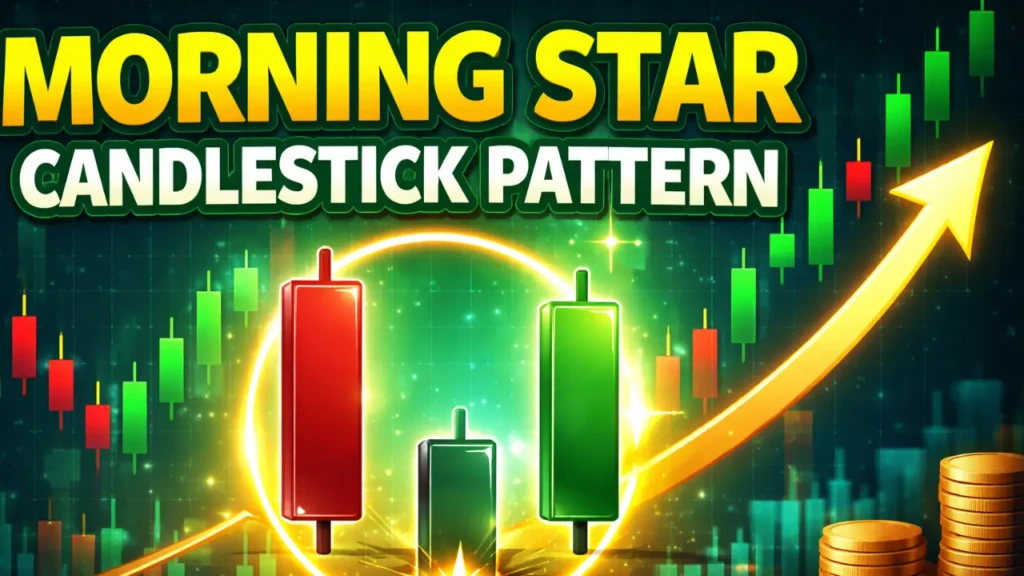
The Morning Star pattern is formed by three consecutive candlesticks, with the first candle being a long bearish candle, indicating a strong dominance of sellers in the market. This candle has a large body, strengthening the continuation of a downtrend, where buyers appear to be retreating and sellers are fully demonstrating their strength. The second candle has a small body, often appearing as a doji or spinning top, and reflects the uncertainty and balance prevailing in the market. The third candle emerges as a strong bullish candle, closing above the midpoint of the first candle, clearly confirming the return of buyers and a trend reversal.
Psychological Background of the Formation
The market psychology behind this pattern is extremely interesting, as during the first candle, sellers completely dominate the market, and investors fear losses. With the second candle, sellers’ momentum wanes, and buyers enter cautiously, creating a stagnation in the market. The third candle breaks this balance, attracting a large influx of buyers, triggering a price increase, and bringing the bearish phase to an end. This psychological shift teaches traders that the market is never static and that true strength emerges only after a peak of weakness.
Key Identification Characteristics
Accurately identifying the Morning Star pattern requires attention to certain characteristics, such as the pattern always appearing at the end of a clear downtrend. The low end of the first candle should be below the low end of the second candle, while the closing price of the third candle should be more than half the height of the first candle’s body. An increase in trading volume, especially during the third candle, is also an important confirmation of the pattern’s authenticity. The appearance of this pattern near a support level or in the oversold zone of another bullish indicator, such as the RSI, further enhances its strength.
Trading Strategies
Trading strategies using this pattern can be extremely effective, with the best approach being to take a long position as soon as the third candle closes. Place a stop loss below the low of the second candle to protect against a false breakdown, and set a target at the nearest resistance level or 1.5 times the pattern height. It’s sometimes wise to wait for confirmation from the fourth candle, especially in volatile markets. Using this pattern in conjunction with other tools, such as moving averages or MACD, along with proper risk management, significantly increases the likelihood of success. Both short- and long-term traders can profit from this strategy.
Limitations and Precautions
Although the Morning Star pattern is powerful, it doesn’t always deliver accurate results, especially in sideways markets or low volume. To avoid false signals, always seek multiple confirmations and evaluate the overall market trend. Its reliability decreases on shorter timeframes, so prioritize using it on daily or weekly charts. Successful traders view this pattern as a tool, not a sole reliance.
Practical Example
Imagine a stock is in a long downtrend, and suddenly, after the first red candle, a small doji appears, followed by a strong green candle that covers previous losses. This pattern has been observed repeatedly in real markets, such as in stocks like Bank Nifty or Reliance, where it has signaled a 10-20% rally. Studying such examples can help traders improve their skills.
Disclaimer
This article is for educational and informational purposes only. It is not any investment advice. Before making any investment-related decision, make sure to consult your financial advisor.