
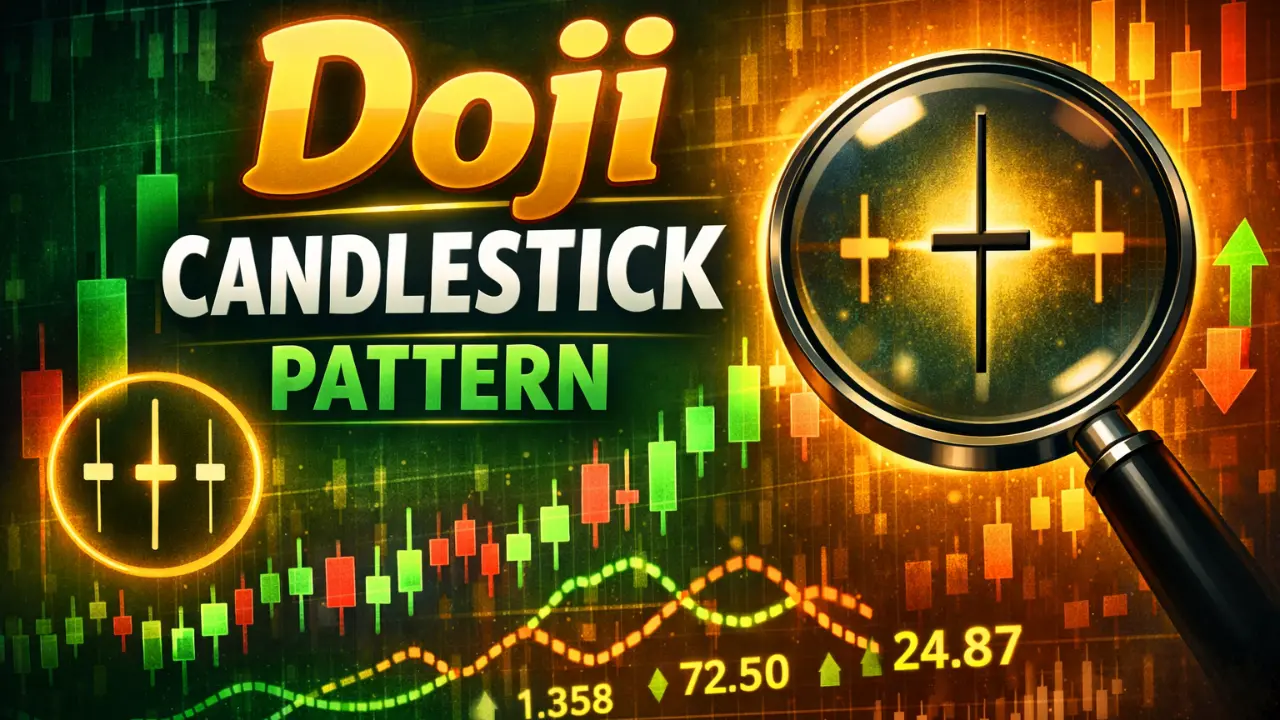
Doji Candlestick Pattern: The importance of candlestick patterns in the stock market is no secret, and the Doji pattern is a unique symbol that perfectly reflects market uncertainty. When the opening and closing prices of a stock or index are approximately equal, a cross- or plus sign-like shape is formed, known as a Doji candle. This pattern reflects a state of balance between buyers and sellers, where no side clearly dominates.
Origin and Characteristics
The word “Doji” is derived from the Japanese word “doji,” meaning “error” or “abnormality.” Prices normally fluctuate, but here they remain almost static. In this pattern, the body of the candle is very small or nonexistent, while the upper and lower shadows determine its direction and intensity. When a bullish or bearish trend in the market subsides, the Doji emerges, alerting traders that a major change may be imminent. This pattern can appear on any time frame, whether it’s a minute chart or a daily one, but its reliability depends on the previous trend and subsequent candles.
Main Types of Doji
The doji pattern has several variations, which give different signals depending on the length and position of the shadows. The most common is the Standard Doji, in which the upper and lower shadows are almost equal in length, indicating complete uncertainty. In the long-legged doji, both shadows are very long, indicating a market rebound after significant volatility. The Dragonfly Doji has a long lower shadow and a short upper shadow, raising hopes of a bullish reversal at the end of a downtrend. In contrast, the Gravestone Doji has a long upper shadow, which foreshadows a bearish trend after an uptrend.
Importance in the Market
The Doji pattern acts as a warning bell for traders, as it signals the exhaustion of the current trend. The appearance of a Gravestone Doji at the top of an uptrend increases the likelihood of a bearish trend, while a Dragonfly Doji at the bottom of a downtrend can signal the arrival of an uptrend. However, a Doji alone is not enough; it must always be confirmed by the next candle or volume. If the next candle has a strong body that contradicts the previous trend, a reversal is considered confirmed. Furthermore, the appearance of a Doji at a support or resistance level multiplies its power.
Doji Trading Strategies
There are some proven strategies to take profitable trades using Doji. First, combine Doji with other indicators, such as the RSI or moving averages, to avoid false signals. For example, when a Dragonfly Doji forms in a downtrend, wait for the next green candle and then take a long position, keeping the stop loss at a lower level. Similarly, plan a short trade on a gravestone in an uptrend. Sometimes a doji also signals a continuation in a sideways market, so waiting for a breakout is essential. Using the doji in conjunction with risk management can significantly improve traders’ success rates.
Limitations and Precautions
Like every pattern, the doji has limitations. It can give false signals in low-volume markets, so choose scripts with high trading volume. Furthermore, don’t rely solely on the doji; always analyze multiple time frames. The reliability of the doji diminishes during news events or economic data. Experienced traders combine the doji with structural analysis, such as Fibonacci levels or trendlines. When used in the right context, the doji becomes a powerful trading tool.
Conclusion
The doji candlestick pattern is a simple yet effective way to understand market sentiment. By understanding its variations and trading with the right confirmation, investors can strengthen their strategy. Regular practice and chart study make it easier to recognize Doji signals.
Disclaimer
This article is for educational and informational purposes only. It is not any investment advice. Before making any investment-related decision, make sure to consult your financial advisor.